Genetic variation refers to diversity in gene frequencies. Genetic variation can refer to differences between individuals or to differences between populations. Mutation is the ultimate source of genetic variation, but mechanisms such as sexual reproduction and genetic drift contribute to it as well.
Genetic variation is the difference in DNA among individuals or the differences between populations. There are multiple sources of genetic variation, including mutation and genetic recombination.[rx] Mutations are the ultimate sources of genetic variation, but other mechanisms such as sexual reproduction and genetic drift contribute to it as well.[rx]
Variation in the human genome can take several forms. Simple single nucleotide polymorphisms, or SNPs, is one form. But in another form actually involves a larger-scale variation where you might have a stretch of DNA of hundreds, or even thousands, of base pairs that is different between people. Maybe I have three copies of that stretch and you have two. Or maybe it’s a circumstance where I have the genes in the order ABC and you have them in the order of ACB because you have an inversion in that. Those don’t have to be pathological. In fact, most of them won’t be, but it’s a different kind of variation that in some instances may be playing a role in disease risk.
Types
Gene variants can be inherited from a parent or occur during a person’s lifetime
- Inherited (or hereditary) variants – are passed from parent to child and are present throughout a person’s life in virtually every cell in the body. These variants are also called germline variants because they are present in the parent’s egg or sperm cells, which are also called germ cells. When an egg and a sperm cell unite, the resulting fertilized egg cell contains DNA from both parents. Any variants that are present in that DNA will be present in the cells of the child that grows from the fertilized egg.
- Non-inherited variants – occur at some time during a person’s life and are present only in certain cells, not in every cell in the body. Because non-inherited variants typically occur in somatic cells (cells other than sperm and egg cells), they are often referred to as somatic variants. These variants cannot be passed to the next generation. Non-inherited variants can be caused by environmental factors such as ultraviolet radiation from the sun or can occur if an error is made as DNA copies itself during cell division.
Some genetic changes are described as new (de novo) variants; these variants are recognized in a child but not in either parent. In some cases, the variant occurs in a parent’s egg or sperm cell but is not present in any of their other cells. In other cases, the variant occurs in the fertilized egg shortly after the egg and sperm cells unite. (It is often impossible to tell exactly when a de novo variant happened.) As the fertilized egg divides, each resulting cell in the growing embryo will have the variant. De novo variants are one explanation for genetic disorders in which an affected child has a variant in every cell in the body, but the parents do not, and there is no family history of the disorder.
Variants acquired during development can lead to a situation called mosaicism, in which a set of cells in the body has a different genetic makeup than others. In mosaicism, the genetic change is not present in a parent’s egg or sperm cells, or in the fertilized egg, but happens later, anytime from embryonic development through adulthood. As cells grow and divide, cells that arise from the cell with the altered gene will have the variant, while other cells will not. When a proportion of somatic cells have a gene variant and others do not, it is called somatic mosaicism. Depending on the variant and how many cells are affected, somatic mosaicism may or may not cause health problems. When a proportion of egg or sperm cells have a variant and others do not, it is called germline mosaicism. In this situation, an unaffected parent can pass a genetic condition to their child.
Most variants do not lead to development of disease, and those that do are uncommon in the general population. Some variants occur often enough in the population to be considered common genetic variation. Several such variants are responsible for differences between people such as eye color, hair color, and blood type. Although many of these common variations in the DNA have no negative effects on a person’s health, some may influence the risk of developing certain disorders.
Genetic Variation
Genetic variation is a measure of the variation that exists in the genetic makeup of individuals within population.
Key Points
Genetic variation is an important force in evolution as it allows natural selection to increase or decrease frequency of alleles already in the population.
Genetic variation can be caused by mutation (which can create entirely new alleles in a population), random mating, random fertilization, and recombination between homologous chromosomes during meiosis (which reshuffles alleles within an organism’s offspring).
Genetic variation is advantageous to a population because it enables some individuals to adapt to the environment while maintaining the survival of the population.
Key Terms
- genetic diversity: the level of biodiversity, refers to the total number of genetic characteristics in the genetic makeup of a species
- crossing over: the exchange of genetic material between homologous chromosomes that results in recombinant chromosomes
- phenotypic variation: variation (due to underlying heritable genetic variation); a fundamental prerequisite for evolution by natural selection
- genetic variation: variation in alleles of genes that occurs both within and among populations
- Human genetic variants are typically referred to as either common or rare, to denote the frequency of the minor allele in the human population. Genetic variants can also be divided into two different nucleotide composition classes — single nucleotide variants and structural variants.
- The alleles of SNPs located in the same genomic interval are often correlated with one another. This correlation structure, or linkage disequilibrium (LD), varies in a complex and unpredictable manner across the genome and between different populations.
- Structural variants seem to behave similarly to SNPs in terms of both genomic and population distribution, indicating a similar evolutionary history: both types of variants are ‘ancestral’ having arisen once in human history and then shared among individuals by descent rather than being the result of recurrent mutations.
- Full sequencing of human genomes has shown that in any given individual there are, on average, ∼4 million genetic variants encompassing ∼12 Mb of sequence. The challenge is to determine which of these variants underlie or are responsible for the inherited components of phenotypes.
- Over the last decade or so the human genetics field has debated the common disease–common variant hypothesis, which posits that common complex traits are largely due to common variants with small-to-modest affect sizes. The opposing theory, the rare variant hypothesis, posits that common complex traits are the summation of low-frequency, high-penetrance variants.
- Genome-wide association (GWA) studies are the most widely used contemporary approach to relate genetic variation to phenotypic diversity. Over the past 2 years these studies have identified statistical association between hundreds of loci across the genome and common complex traits.
- Most of the genes or genomic loci that have been identified by GWA studies have not previously been known to be related to the complex trait under investigation. Surprisingly, there have been several instances in which one genomic interval has been associated with two or more seemingly distinct diseases.
- An unforeseen limitation of GWA studies is that the genomic markers that are found to be associated with any given complex trait each have less impact on susceptibility than was anticipated. Most of the odds ratios for the heterozygote genotypes of the associated variants that have been identified so far are approximately 1.1, a figure that can increase to 1.5–1.6 for homozygote genotypes.
- At this point, there are almost no complex traits for which more than 10% of the genetic variance is explained, and many are far below that threshold, leaving the bulk of heritability unexplained by the common variants identified so far.
- One possibility is that the missing variation is accounted for by common genetic variants with small effect sizes that have not yet been identified. Some of the missing heritability is probably accounted for by rare and novel variants. Additionally, there are statistical limitations of the GWA approach in identifying gene–gene and gene–environment interactions, which are likely to be profoundly important.
Genetic Variation
Genetic variation is a measure of the genetic differences that exist within a population. The genetic variation of an entire species is often called genetic diversity. Genetic variations are the differences in DNA segments or genes between individuals and each variation of a gene is called an allele.For example, a population with many different alleles at a single chromosome locus has a high amount of genetic variation. Genetic variation is essential for natural selection because natural selection can only increase or decrease frequency of alleles that already exist in the population.
Genetic variation is caused by:
- mutation
- random mating between organisms
- random fertilization
- crossing over (or recombination) between chromatids of homologous chromosomes during meiosis
The last three of these factors reshuffle alleles within a population, giving offspring combinations which differ from their parents and from others.
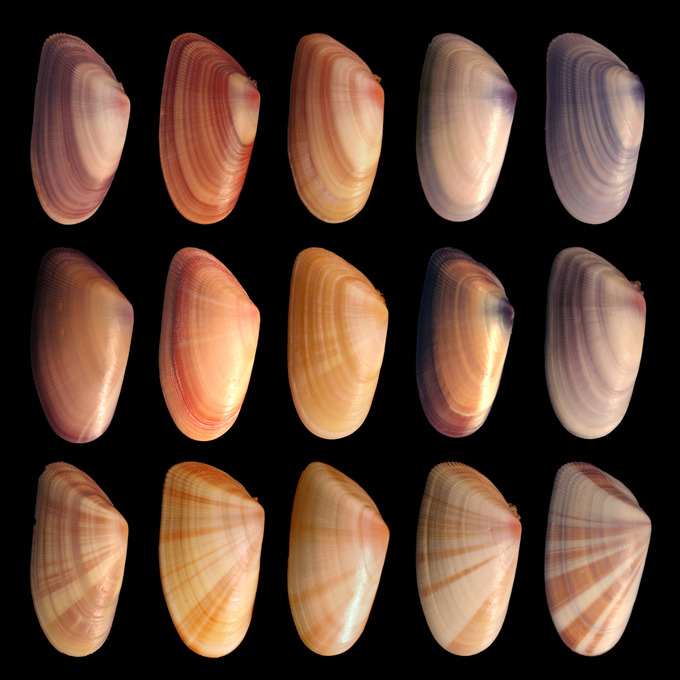
Genetic variation in the shells of Donax variabilis: An enormous amount of phenotypic variation exists in the shells of Donax varabilis, otherwise known as the coquina mollusc. This phenotypic variation is due at least partly to genetic variation within the coquina population.
Evolution and Adaptation to the Environment
Low genetic diversity in the wild cheetah population
Populations of wild cheetahs have very low genetic variation. Because wild cheetahs are threatened, their species has a very low genetic diversity. This low genetic diversity means they are often susceptible to disease and often pass on lethal recessive mutations; only about 5% of cheetahs survive to adulthood.
Variation allows some individuals within a population to adapt to the changing environment. Because natural selection acts directly only on phenotypes, more genetic variation within a population usually enables more phenotypic variation. Some new alleles increase an organism’s ability to survive and reproduce, which then ensures the survival of the allele in the population. Other new alleles may be immediately detrimental (such as a malformed oxygen-carrying protein) and organisms carrying these new mutations will die out. Neutral alleles are neither selected for nor against and usually remain in the population. Genetic variation is advantageous because it enables some individuals and, therefore, a population, to survive despite a changing environment.
Geographic Variation
Some species display geographic variation as well as variation within a population. Geographic variation, or the distinctions in the genetic makeup of different populations, often occurs when populations are geographically separated by environmental barriers or when they are under selection pressures from a different environment. One example of geographic variation are clines: graded changes in a character down a geographic axis.
Sources of Genetic Variation
Gene duplication, mutation, or other processes can produce new genes and alleles and increase genetic variation. New genetic variation can be created within generations in a population, so a population with rapid reproduction rates will probably have high genetic variation. However, existing genes can be arranged in new ways from chromosomal crossing over and recombination in sexual reproduction. Overall, the main sources of genetic variation are the formation of new alleles, the altering of gene number or position, rapid reproduction, and sexual reproduction.
Mendel’s Law of Segregation
Mendel’s Law of Segregation states that a diploid organism passes a randomly selected allele for a trait to its offspring, such that the offspring receives one allele from each parent.
Key Points
Each gamete acquires one of the two alleles as chromosomes separate into different gametes during meiosis.
Heterozygotes, which posess one dominant and one recessive allele, can receive each allele from either parent and will look identical to homozygous dominant individuals; the Law of Segregation supports Mendel’s observed 3:1 phenotypic ratio.
Mendel proposed the Law of Segregation after observing that pea plants with two different traits produced offspring that all expressed the dominant trait, but the following generation expressed the dominant and recessive traits in a 3:1 ratio.
Key Terms
- law of segregation: a diploid individual possesses a pair of alleles for any particular trait and each parent passes one of these randomly to its offspring
Equal Segregation of Alleles
Observing that true-breeding pea plants with contrasting traits gave rise to F1 generations that all expressed the dominant trait and F2 generations that expressed the dominant and recessive traits in a 3:1 ratio, Mendel proposed the law of segregation. The law of segregation states that each individual that is a diploid has a pair of alleles (copy) for a particular trait. Each parent passes an allele at random to their offspring resulting in a diploid organism. The allele that contains the dominant trait determines the phenotype of the offspring. In essence, the law states that copies of genes separate or segregate so that each gamete receives only one allele.

The Law of Segregation states that alleles segregate randomly into gametes: When gametes are formed, each allele of one parent segregates randomly into the gametes, such that half of the parent’s gametes carry each allele.
For the F2 generation of a monohybrid cross, the following three possible combinations of genotypes could result: homozygous dominant, heterozygous, or homozygous recessive. Because heterozygotes could arise from two different pathways (receiving one dominant and one recessive allele from either parent), and because heterozygotes and homozygous dominant individuals are phenotypically identical, the law supports Mendel’s observed 3:1 phenotypic ratio. The equal segregation of alleles is the reason we can apply the Punnett square to accurately predict the offspring of parents with known genotypes.
The physical basis of Mendel’s law of segregation is the first division of meiosis in which the homologous chromosomes with their different versions of each gene are segregated into daughter nuclei. The behavior of homologous chromosomes during meiosis can account for the segregation of the alleles at each genetic locus to different gametes. As chromosomes separate into different gametes during meiosis, the two different alleles for a particular gene also segregate so that each gamete acquires one of the two alleles. In Mendel’s experiments, the segregation and the independent assortment during meiosis in the F1 generation give rise to the F2 phenotypic ratios observed by Mendel. The role of the meiotic segregation of chromosomes in sexual reproduction was not understood by the scientific community during Mendel’s lifetime.
Mendel’s Law of Independent Assortment
Independent assortment allows the calculation of genotypic and phenotypic ratios based on the probability of individual gene combinations.
Key Points
Mendel’s law of independent assortment states that genes do not influence each other with regard to the sorting of alleles into gametes; every possible combination of alleles for every gene is equally likely to occur.
The calculation of any particular genotypic combination of more than one gene is, therefore, the probability of the desired genotype at the first locus multiplied by the probability of the desired genotype at the other loci.
The forked line method can be used to calculate the chances of all possible genotypic combinations from a cross, while the probability method can be used to calculate the chance of any one particular genotype that might result from that cross.
Key Terms
- independent assortment: separate genes for separate traits are passed independently of one another from parents to offspring
Independent Assortment
Mendel’s law of independent assortment states that genes do not influence each other with regard to the sorting of alleles into gametes: every possible combination of alleles for every gene is equally likely to occur. The independent assortment of genes can be illustrated by the dihybrid cross: a cross between two true-breeding parents that express different traits for two characteristics. Consider the characteristics of seed color and seed texture for two pea plants: one that has green, wrinkled seeds (yyrr) and another that has yellow, round seeds (YYRR). Because each parent is homozygous, the law of segregation indicates that the gametes for the green/wrinkled plant all are yr, while the gametes for the yellow/round plant are all YR. Therefore, the F1 generation of offspring all are YyRr.
For the F2 generation, the law of segregation requires that each gamete receive either an R allele or an r allele along with either a Y allele or a y allele. The law of independent assortment states that a gamete into which an r allele sorted would be equally likely to contain either a Y allele or a y allele. Thus, there are four equally likely gametes that can be formed when the YyRr heterozygote is self-crossed as follows: YR, Yr, yR, and yr. Arranging these gametes along the top and left of a 4 × 4 Punnett square gives us 16 equally likely genotypic combinations. From these genotypes, we infer a phenotypic ratio of 9 round/yellow:3 round/green:3 wrinkled/yellow:1 wrinkled/green. These are the offspring ratios we would expect, assuming we performed the crosses with a large enough sample size.
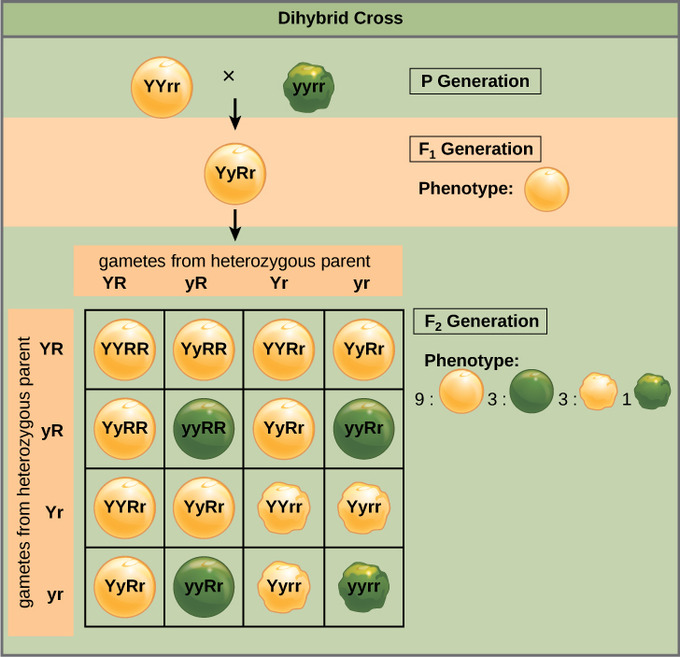
Independent assortment of 2 genes: This dihybrid cross of pea plants involves the genes for seed color and texture.
Because of independent assortment and dominance, the 9:3:3:1 dihybrid phenotypic ratio can be collapsed into two 3:1 ratios, characteristic of any monohybrid cross that follows a dominant and recessive pattern. Ignoring seed color and considering only seed texture in the above dihybrid cross, we would expect that three-quarters of the F2 generation offspring would be round and one-quarter would be wrinkled. Similarly, isolating only seed color, we would assume that three-quarters of the F2 offspring would be yellow and one-quarter would be green. The sorting of alleles for texture and color are independent events, so we can apply the product rule. Therefore, the proportion of round and yellow F2 offspring is expected to be (3/4) × (3/4) = 9/16, and the proportion of wrinkled and green offspring is expected to be (1/4) × (1/4) = 1/16. These proportions are identical to those obtained using a Punnett square. Round/green and wrinkled/yellow offspring can also be calculated using the product rule as each of these genotypes includes one dominant and one recessive phenotype. Therefore, the proportion of each is calculated as (3/4) × (1/4) = 3/16.
Forked-Line Method
When more than two genes are being considered, the Punnett-square method becomes unwieldy. For instance, examining a cross involving four genes would require a 16 × 16 grid containing 256 boxes. It would be extremely cumbersome to manually enter each genotype. For more complex crosses, the forked-line and probability methods are preferred.
To prepare a forked-line diagram for a cross between F1 heterozygotes resulting from a cross between AABBCC and aabbcc parents, we first create rows equal to the number of genes being considered and then segregate the alleles in each row on forked lines according to the probabilities for individual monohybrid crosses. We then multiply the values along each forked path to obtain the F2 offspring probabilities. Note that this process is a diagrammatic version of the product rule. The values along each forked pathway can be multiplied because each gene assorts independently. For a trihybrid cross, the F2 phenotypic ratio is 27:9:9:9:3:3:3:1.
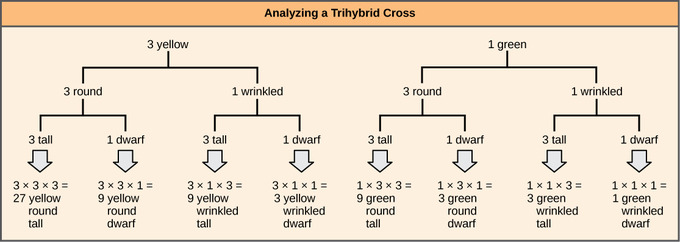
Independent assortment of 3 genes: The forked-line method can be used to analyze a trihybrid cross. Here, the probability for color in the F2 generation occupies the top row (3 yellow:1 green). The probability for shape occupies the second row (3 round:1 wrinked), and the probability for height occupies the third row (3 tall:1 dwarf). The probability for each possible combination of traits is calculated by multiplying the probability for each individual trait. Thus, the probability of F2 offspring having yellow, round, and tall traits is 3 × 3 × 3, or 27.
Probability Method
While the forked-line method is a diagrammatic approach to keeping track of probabilities in a cross, the probability method gives the proportions of offspring expected to exhibit each phenotype (or genotype) without the added visual assistance.
To fully demonstrate the power of the probability method, however, we can consider specific genetic calculations. For instance, for a tetrahybrid cross between individuals that are heterozygotes for all four genes, and in which all four genes are sorting independently in a dominant and recessive pattern, what proportion of the offspring will be expected to be homozygous recessive for all four alleles? Rather than writing out every possible genotype, we can use the probability method. We know that for each gene the fraction of homozygous recessive offspring will be 1/4. Therefore, multiplying this fraction for each of the four genes, (1/4) × (1/4) × (1/4) × (1/4), we determine that 1/256 of the offspring will be quadruply homozygous recessive.
Refernces